Maps of Gowanus
August 2021 - current
In my field work in Gowanus from 2021-2023, I made a variety of maps of the region. Here are some examples of that work.

A hand-drawn map of NYC with emphasis on Gowanus and its surrounding area.

A map of Brooklyn with an emphasis on Gowanus and the Gowanus Neighborhood Plan rezoning with red lines.

A hand-drawn map of the Gowanus area with attention to locations of interest to my thesis work.

This map was created in QGIS.
The next series of maps were created in R using the ggplotly R package, shape files from NYC Open Data, and 2020 Decennial Census data.

This map of Gowanus shows the broader area— including all of Community Board 6 (outlined in yellow).

This map of Gowanus shows the neighborhood tabulation area (outlined in red).

This map shows census tracts within the neighborhood of Gowanus only.
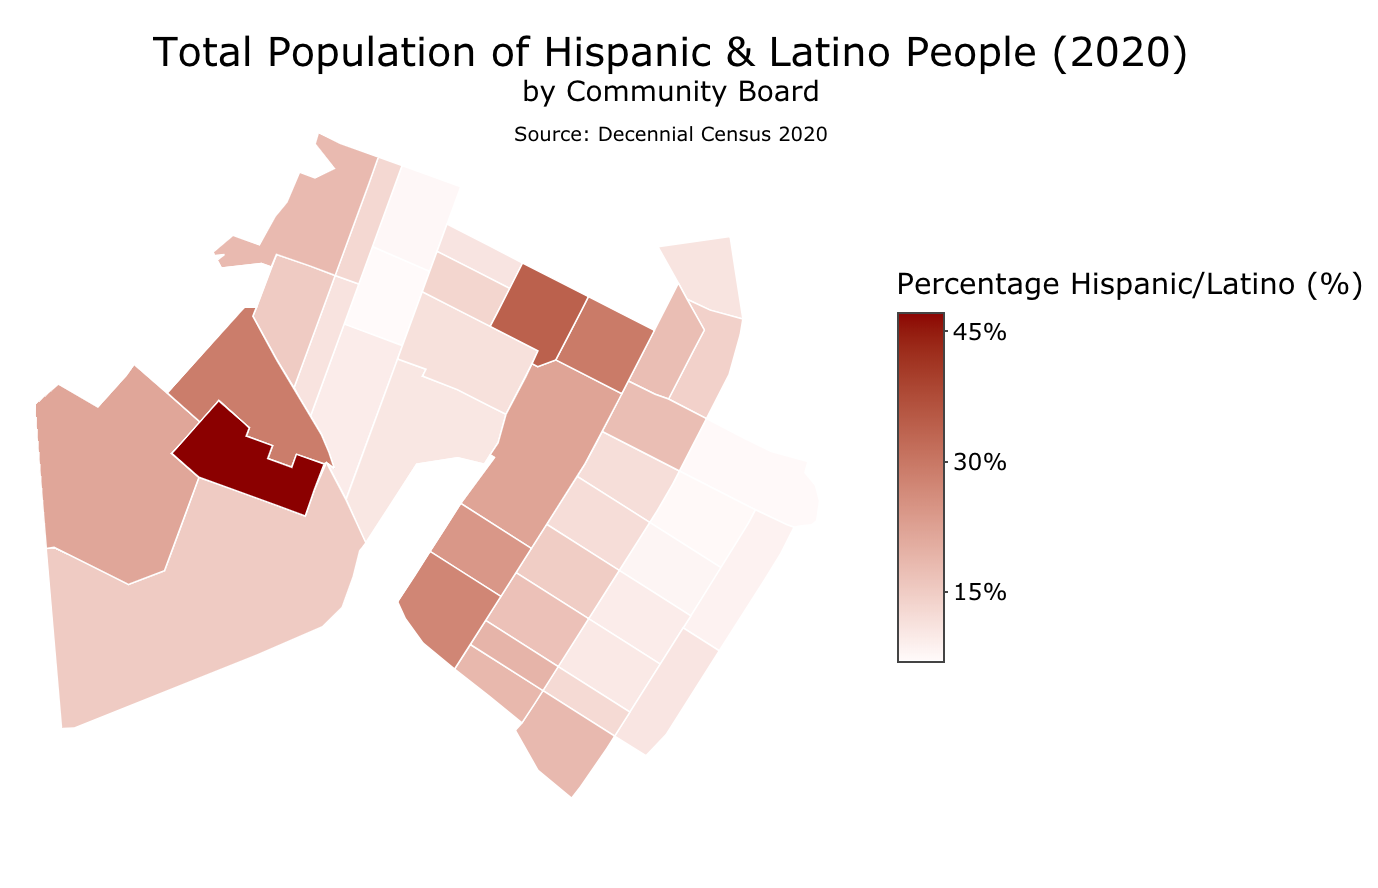
This map of Gowanus shows the demographic breakdown of Hispanic and Latino people in 2020 — indicating relatively few Hispanic & Latino people in the region.

This map of Gowanus shows the demographic breakdown of Hispanic and Latino people in 2020 — indicating mass displacement between 2000 to 2020.

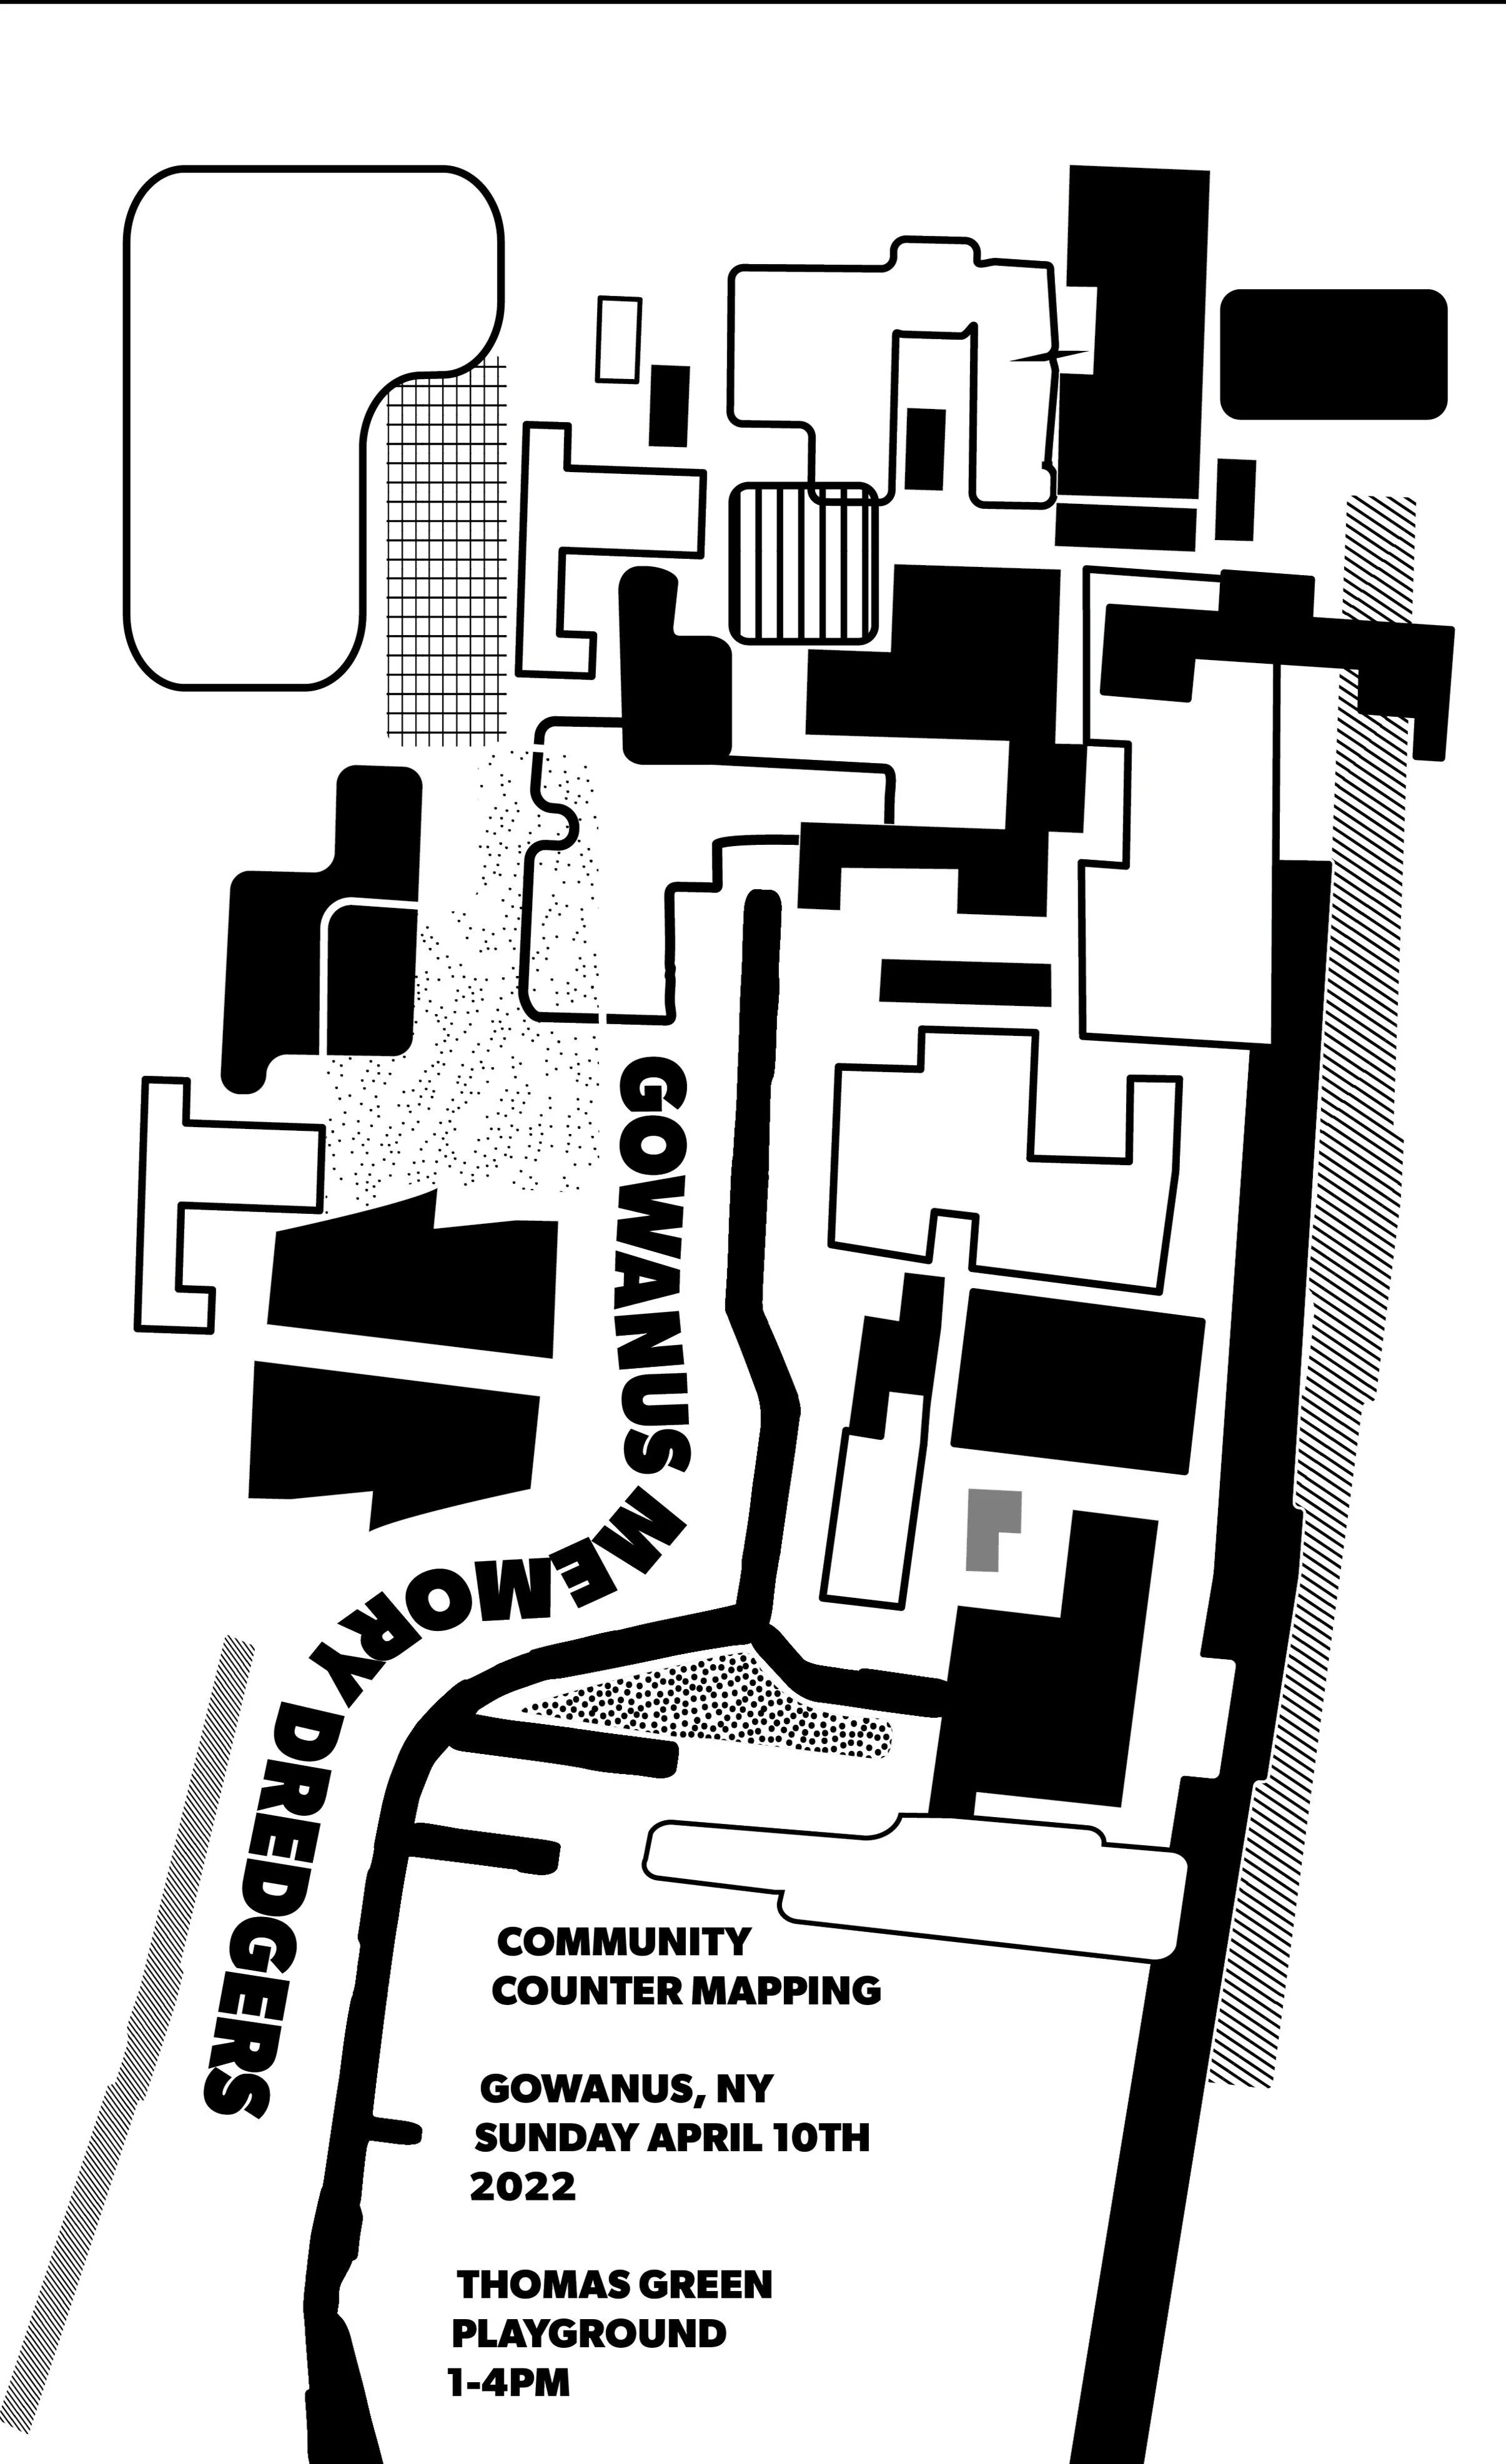
This map was part of the project, Critical Cartography: Capturing Collective Memory in Gowanus, Brooklyn. It includes data from people who attended our pop-up events in Gowanus around the themes of movement, emotions, memories, and home.
A creative re-envisioning of Gowanus using the shapes used in the land use rezoning map of the region.